The ultimate dental practice analytics dashboard
Request a Demo
Questions? Ask us on the live chat to the bottom right.
Production Collections Procedures Patients Appointments Practice & Providers
Production
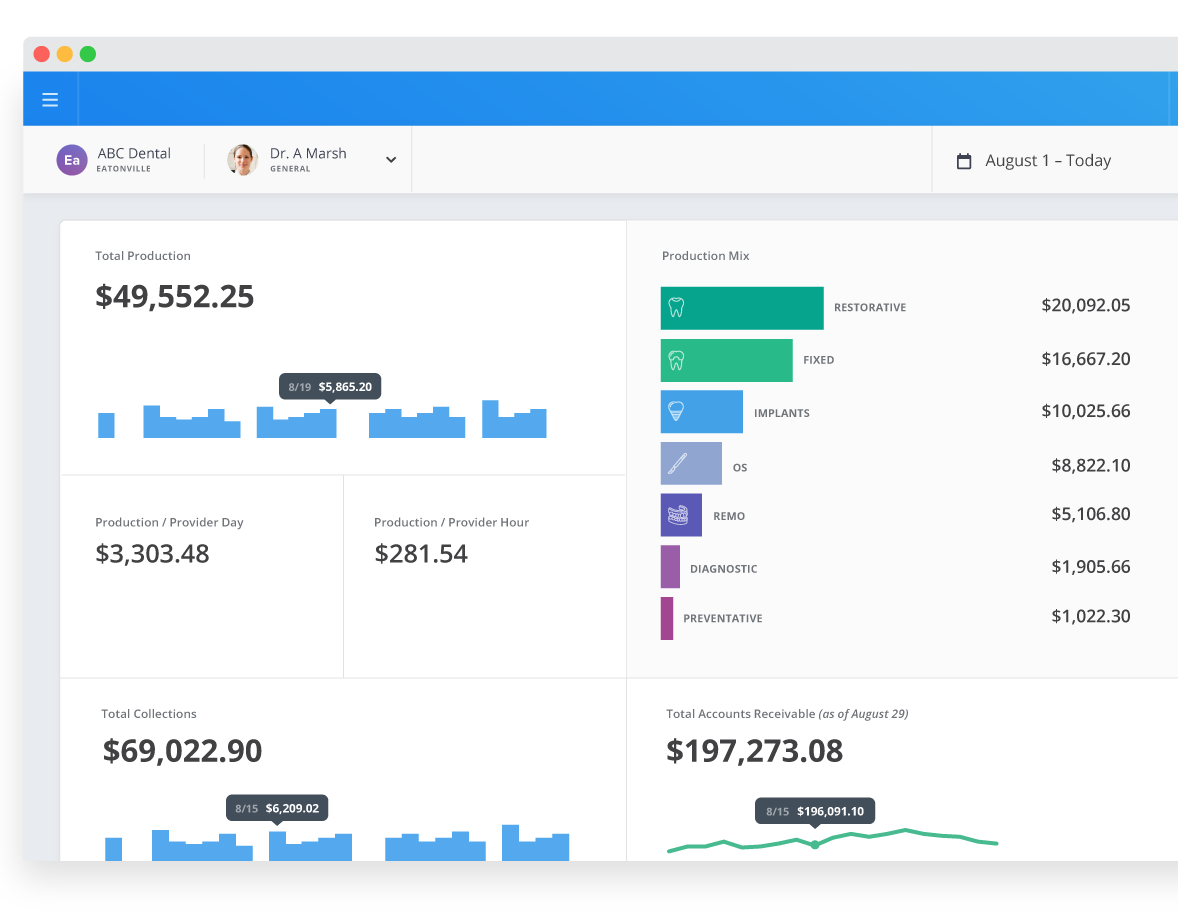
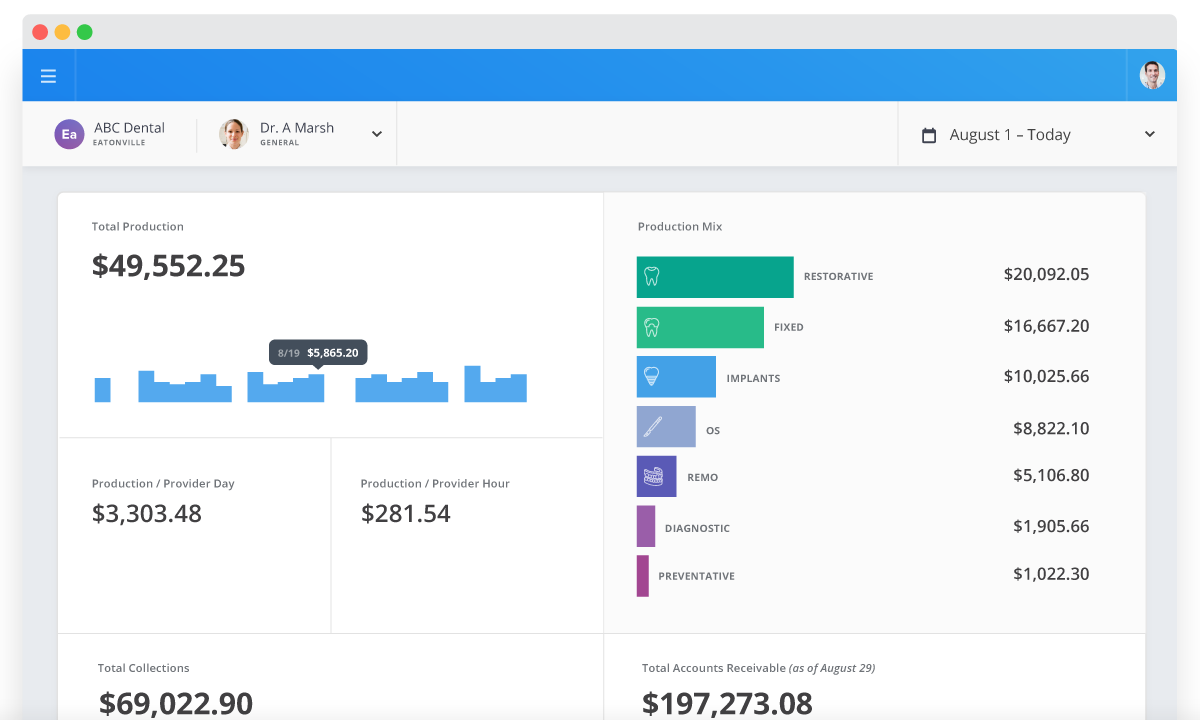
Track production effortlessly
Production numbers, trends, and variations with just one glance.
Hygiene: Dentist Ratios
Consultants often tell practices to track this metric (and that it should be 30:70). Now it's continuously monitored.
Over any date range
Instantly see production over any date range (from today or since the practice opened its doors).
Production by department
Production broken down by dentist, specialist, or the hygiene department produced.
Production Averages
Ideal for forecasting future revenue goals is understanding the average revenue produced per day.
Filter by practice or provider
In-depth production metrics for every practice and provider.
Production breakdown by departments
provides a detailed look at revenue over time
Hygiene : Dentist Ratio
indicates a healthy or unhealthy hygiene department
Production Averages
serve as quick benchmarks to compare practices or providers
Collections
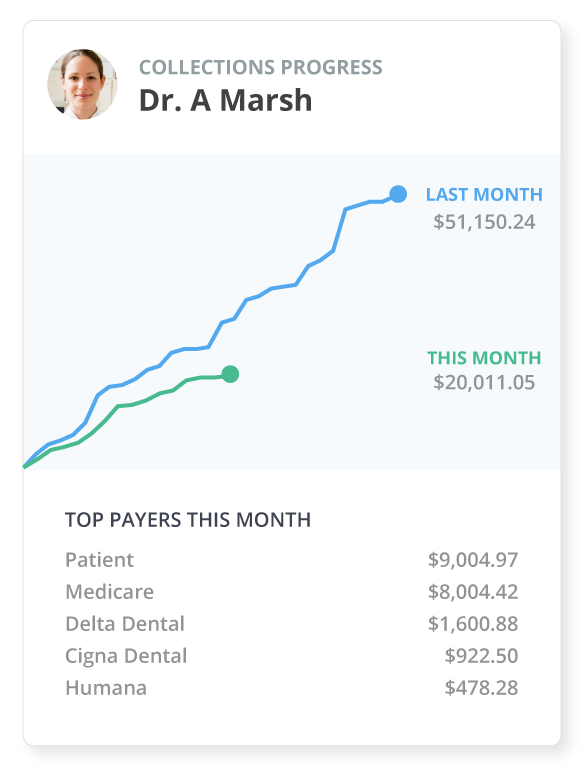
Track collections progress
See how collections progress compares to the previous month. Forecast how much in payments your practice is expected to receive that month.
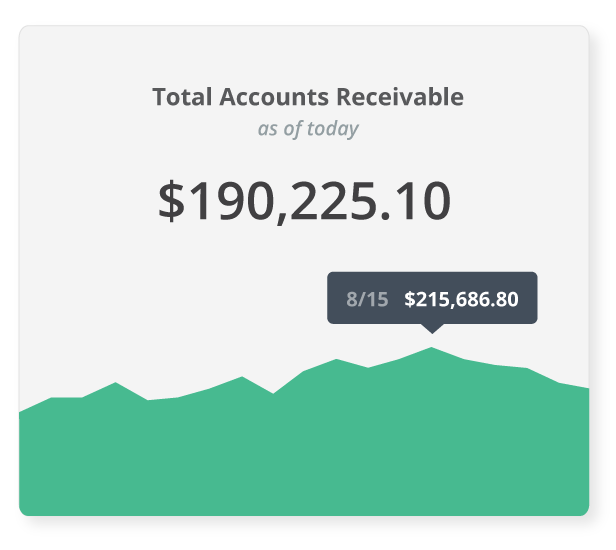
Total AR
Know how much is sitting in your accounts receivable. Instantly visualize whether the total in AR is trending up or down over time.
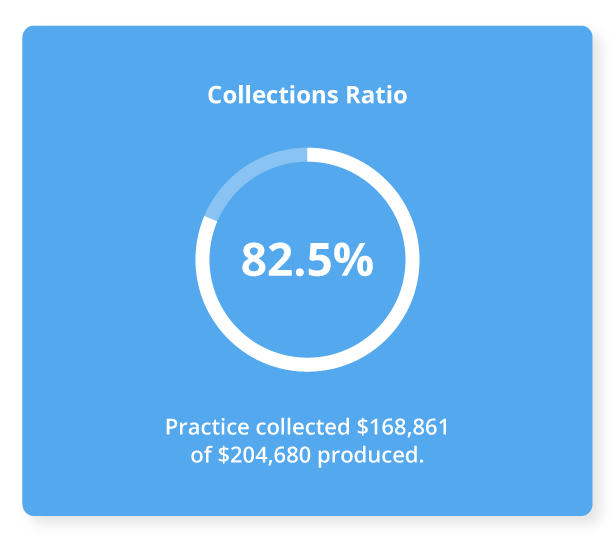
Collections Ratio
Instantly assess collection health, or how successfully your team is collecting on services rendered.
AR Days
Predict how many days it will take to collect payment based on historical daily collections.
AR Aging
See how much and how long (< 30 days, 30-60, 60-90, 90+) total money is owed to your practice.
Collections by Department
A detailed look at which departments, like hygiene or specialty dentistry, are collecting successfully.
Filter by practice or provider
In-depth collections metrics for every practice or provider.
Payer Profiles
In-depth profiles of payers your practice works with. Uncover the plans that are beneficial and those that are not.
Collections Ratio
shows how effective you really are with collecting on your production.
Collections Progress
tracks your collections to see if you're ahead or behind.
Total AR
visualizes the total amount in accounts receivable over time.
Payer Profiles
With detailed Payer Profiles that include success and failure rates, it’s easy to see which payers are working toward your practice’s bottomline and which ones are not.
Procedures
Track completed procedures
Completed procedure count for the full practice, each department, or provider.
Track added procedures
Easily track how many new procedures (your future pipeline of work) are added to your schedule from accepted cases.
Procedure Averages
Knowing the average production per procedure (hygiene, general, specialty) allows for more accurate projections.
Procedure Mix
Visualize the types of procedures that contribute to your practice’s production.
Procedures by Department
See procedures from hygienists, general dentists, and specialists and how they’re contributing to production.
Filter by practice or provider
In-depth procedure metrics for every practice or provider.
Procedure Mix
Visualize which departments and procedures contribute to your practice’s bottomline.
Uncover the unique procedure mix of any practice or provider.
Appointments
Track completed and failed appointments
Easily compare number of completed and failed appointments across locations and providers.
Lost production from failed appointments
Uncover how much is lost in revenue from no-shows and cancellations.
% Chair Time Booked
Booked chair time uncovers how effectively your team is utilizing its chairs.
Appointment Averages
Production/Appointment and Number of Procedures/appointment indicate how productive appointments are.
Appointments by Department
Track number of appointments from the hygiene department, general dentists, to the specialists.
Activity Level
Activity Level visualizations give you a clear high-level picture of how busy your practices or providers are.
Filter by practice or provider
In-depth appointment metrics for every practice or provider.
Your appointments, up close
Ditch the spreadsheets, calculators, and papers, because it’s all automatically calculated - completed and failed appointments, failed totals, the average production you can expect to bring in per booked appointment, and booked chair time.
Activity Levels
Identify trends in peak and off-peak hours across locations and providers. Do high performing practices stay open on Saturdays? Are certain locations or providers already maxed out?

The big picture is easier to see with Activity Levels.
Patients
Patient Growth Tracking
Is your practice’s patient pool growing and how much? Is your practice an expanding or shrinking one?
Active Patients Ratio
Knowing the total number patients isn’t the full picture – what percent of them are active vs. dormant?
Case Acceptance %
Case acceptance is the first step in patient retention. Understand how successful you are in converting new cases to dollars.
Case Averages
How much is your average treatment case total per patient? Make more accurate projections knowing your case averages.
Patient Retention
Bringing in new patients is only worthwhile if you’re retaining them. See how your practice is doing with retention funnels.
Filter by practice or provider
In-depth patient pool metrics for each practice or any provider.
Population Analytics
Identifying underserved regions, measuring competition, or assessing new practice sites is now easy.
Patient Growth & Retention
Everything you need to know about your patient pool in one place. Know whether your practice is in decline or growth, how many patients are active vs dormant, and whether your team is successfully retaining patients.
Population Analytics & Demographics
We pull in important external data so you can make smart and timely business decisions instead of flying blind.
• Asses how competitive or underserved a region is with Practitioner : Population ratios.
• Forecast growth potential off of population’s income, insurance coverage, and other health indicators.
• Evaluate new practice locations confidently.
• Hone in marketing or set new growth targets effectively.
Complete view of every provider
With thorough Provider Profiles, tracking performance of multiple providers is easy and instantaneous. Quickly identify the heavy hitters and those who can use a nudge to improve.
Instant visibility into multiple locations
Tracking the performance of your practices shouldn’t involve mountains of spreadsheets and driving over for surprise check-ins.

Auxpanel gives you full visibility into the performance, unique patient pools, different providers, and strengths or weaknesses of your practices. And all from the comfort of your one dashboard.
Automated Reports & Alerts
Because you have a life outside of the office, Auxpanel continuously monitors practice performance in the background and sends alerts when something is worth your attention. Know when performance is off track before it’s a problem...not six months after it’s happened.
#ProactiveNotReactive.
Your team on the same page
For a team to thrive, it needs to be on the same page. The Auxpanel dashboard brings your providers together under a common mission. Set goals, share them, stay accountable, truly work together.
Simple setup
Integrates with your existing software
Auxpanel automatically works with your existing practice management software.
Useful out-of-the-box
No need to export or import data. Get practice-transforming metrics, analytics, and reporting right after install.
Get the Demo
Ready to measure, automate, and grow? See how Auxpanel can help you take your practice to the next level.
Get Started Now
Install Auxpanel now and get your dashboard today.
Begin Setup